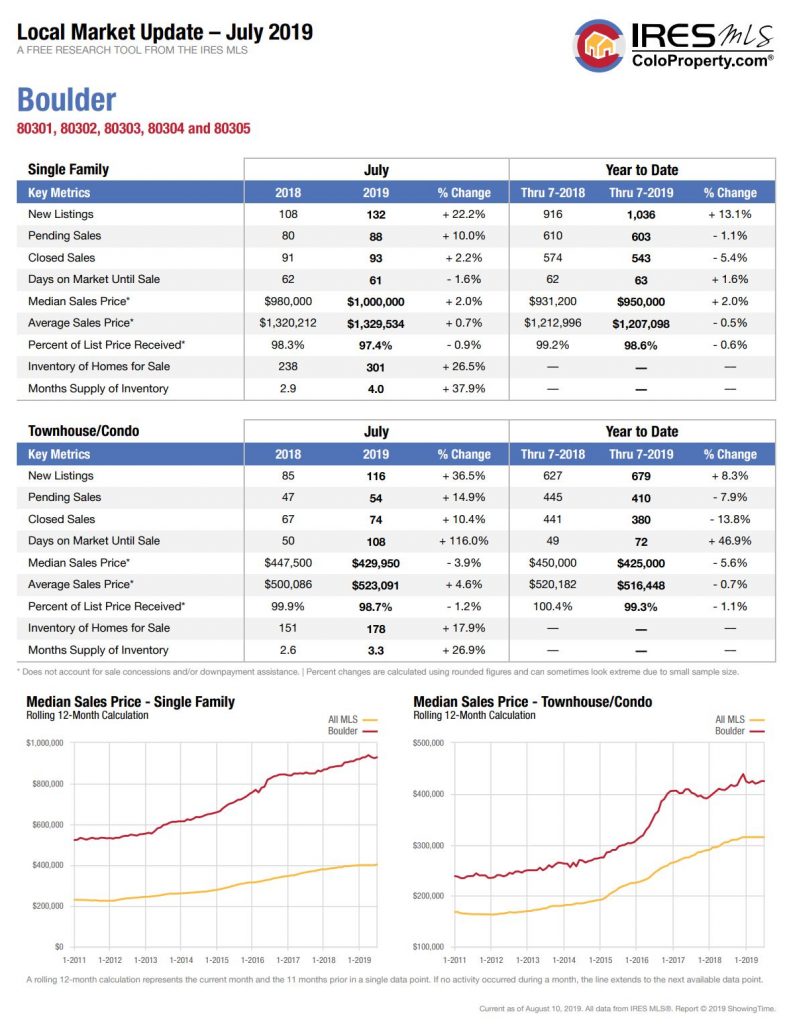
It’s always good to look at the data to see if it supports what I am seeing and hearing in our market. It does. The number of new listings is up as well as the Days on Market (DOM). This chart breaks down data for the City of Boulder by detached homes and townhomes/condos. Condos feel like they have been sitting on the market and indeed they have. DOM is up almost 50% for condos. Pricing your condo well from the beginning is crucial to maximizing your price and minimizing your time on market.
Prices are leveling off to a more sustainable average increase. Months of supply is also up about 30% for both categories. Curious about your area? Let me know and I’ll get you the data.