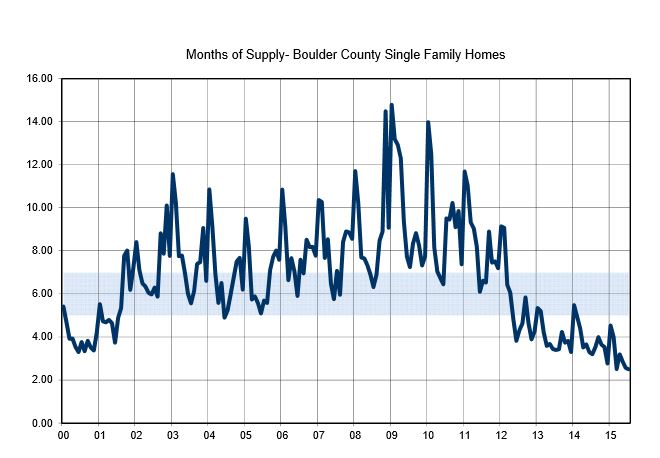
I think these graphs are helpful in understanding the overall Boulder County market on a historical scale. Sure, the market has maybe softened slightly the last few months but in the grand scheme it is still very tight out there. It’s all relative, right? Months of supply/inventory reflects an estimate of the amount of time it would take to sell all of the current listings in a given area if no new listings became available. Anything 0-4 months is considered a seller’s market, 5-7 months is a balanced market and anything over 8 months is a buyer’s market. Boulder County inventory is now down to just over 2 months. Wow! The supply has been heading downwards over the last 3 years. Look at 2009 when we had 14 months of supply!
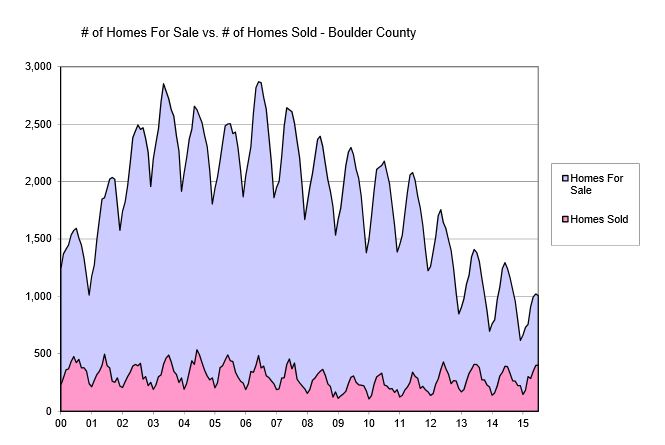
Secondly if we look at the number of homes for sale vs. the number of homes sold you’ll see that after a dip in 2008-2012 in the number of homes sold we’re back up to a more typical average. BUT, look at the number of homes for sale. Each year since 2011 we’ve been losing about 500 listings each year. Now you understand why it feels like there is nothing to buy? Because there isn’t.
My advice to all sellers is to make sure you price your home right and show it in the best condition as soon as you list. Even thought it’s a seller’s market, the homes that are more rough are taking longer to sell. If you are a buyer you need to have your agent send you listings as soon as they hit the market. Multiple offers are still common (maybe we see 2-4 offers for one house instead of 10-12 offers like we did in the spring).
If you are in the market to sell or buy let’s talk and make sure you’re well taken care of throughout the process.